Afghanistan Mw 7.5: a race between the seismic phases
This morning an earthquake of magnitude Mw 7.5 hit the NE part of Afghanistan near the border with Pakistan. The earthquake, which originated at about 200 km depth, occurred because of the compressional tectonic regime that characterizing this region. The Indian continent is moving northward and collides with the Eurasian plate at a rate of about 37 mm/year. The collision of these two continents has caused the orogeny of the highest and widest mountain ranges in the world: the Himalayas, the Karakoram, the Pamir and Hindu Kush, as also explained by our colleagues of #INGVTerremoti. On April 25th, we recorded the earthquake in Nepal along the same plate boundary and we told about it in this poster. In the map below we figure out where the quake occurred calculating the distance between Pisa and the epicenter: we are 5,100 km away, corresponding to about 46 degrees of angular distance.
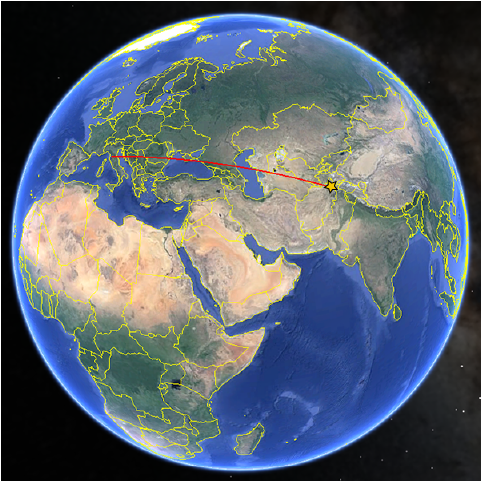
Distance between the epicenter of the earthquake of Afghanistan and Pisa displayed on the globe. It is an arc almost 5100 km long, which corresponds to an angular distance of approximately 46 degrees.
Looking at the ray paths of waves propagating from the earthquake hypocenter (yellow star) and their arrival times at our stations (red triangle) it can be shown that the first waves reaching Pisa are the direct P, followed by the pP (ie. the P reflected by the Earth’s surface in the proximity of the epicenter), then the sP (S waves that are converted into P due to the reflection of the same surface). Later arrivals are PcP (the P reflected from the Mantle/Outer core interface) and PP (P waves bounced from the Earth’s surface. The direct S wave, not shown in the figure, travels slowly and arrives later on. In the figure are also shown the major discontinuities inside the Earth known as layers where refractions and reflections of seismic waves occur.
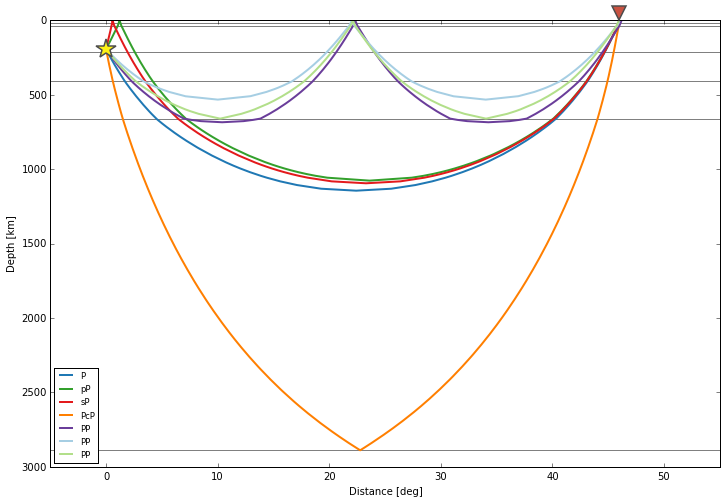
Paths of seismic waves of the earthquake in Afghanistan (yellow star) calculated for an observer placed at a distance of 46 degrees (red triangle). The horizontal lines indicate the main discontinuity in the Earth causing refractions and reflections of seismic waves.
Let’s have a look at our seismograms! The Slinky is quite noisy (as we already mentioned here), but the instrument provided a significant record well above the background noise.
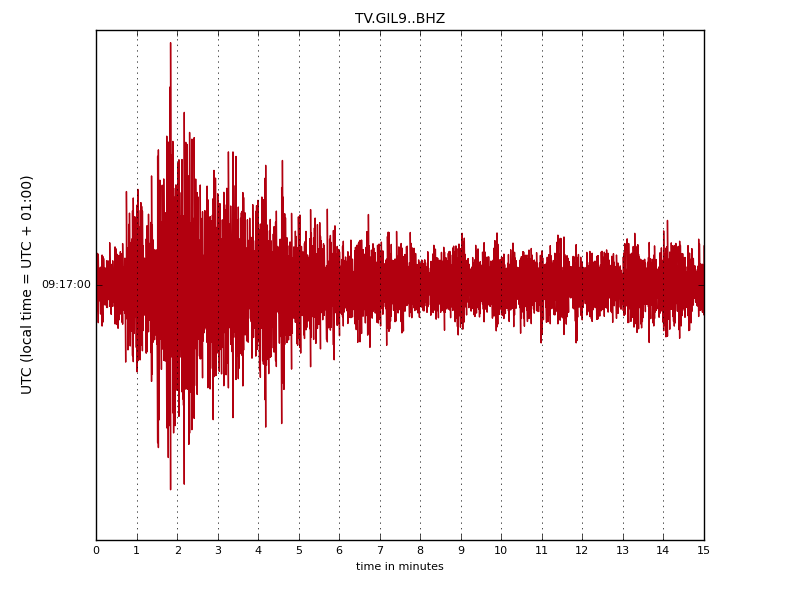
Seismogram of the earthquake in Afghanistan obtained with Slinky seismometer.
The seismogram of the SEP seismometer is certainly more interesting, both for the better quality of the instrument and for its lower natural period, which is closer to the frequencies of a seismic event so big and so far such as the Mw 7.5. Looking at the track below you can see that there are significant variations in the amplitude of the signal and therefore contains a wealth of information.
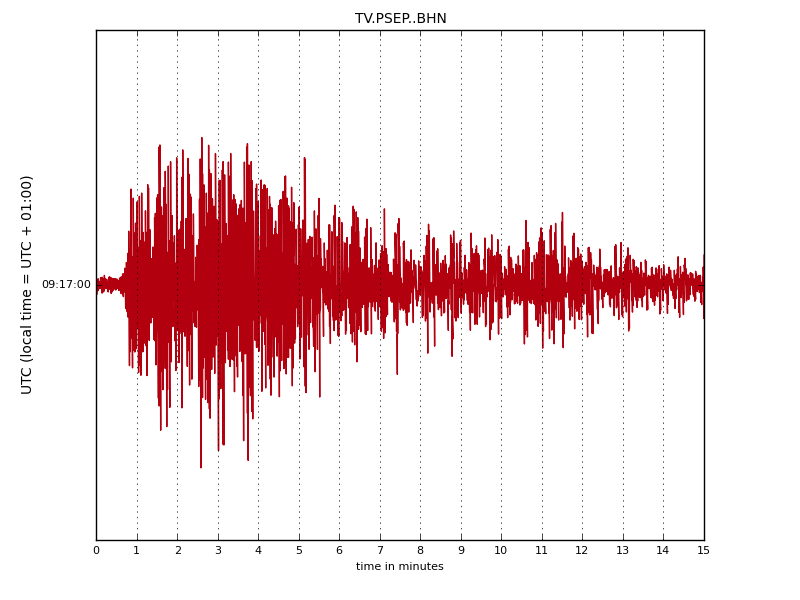
Seismic record of the Mw 7.5 earthquake in Afghanistan (10/26/2015) obtained by SEP seismometer
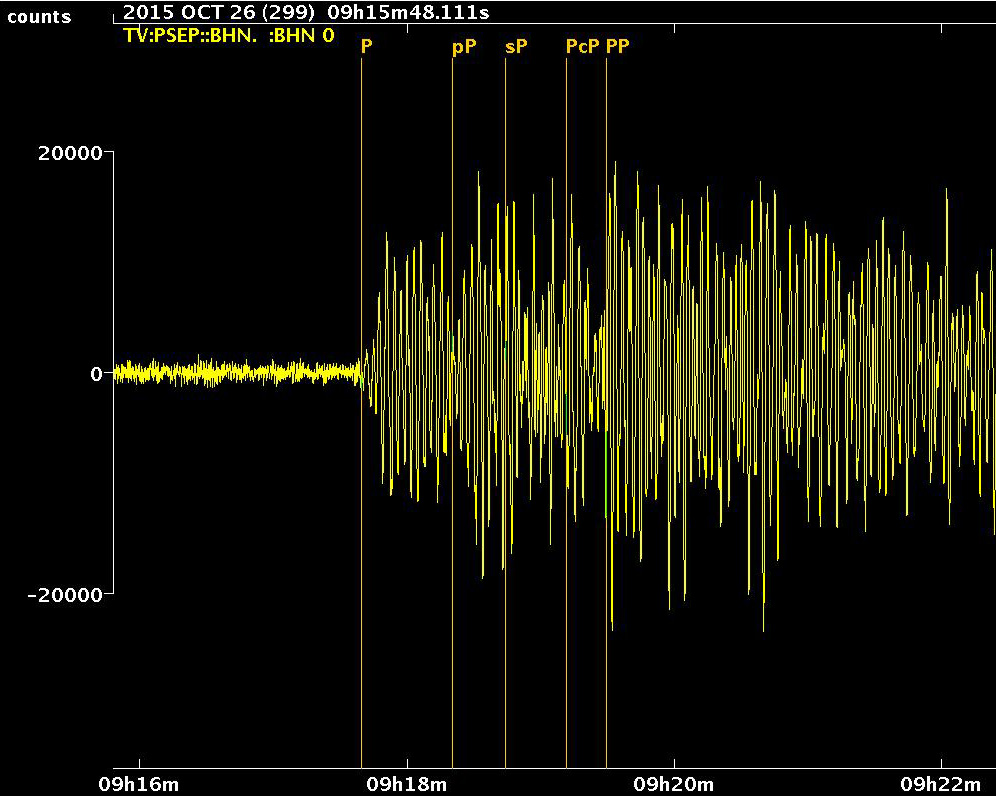
Looking in detail to the first minutes of SEP record we also reported as vertical lines the theoretical arrival times computed using the IASP91 velocity model of the interior of the Earth (Kennet, 1991). The SEP seismometer clearly shows the arrivals of P, pP, PcP and PP phases, while the sP is more difficult to identify.
Mw 7.5 earthquake in Afghanistan (2015, October the 26th) recorded by SEP seismometer and seismic phases.
It is interesting to note that the PcP phase (represented in orange in the ray path figure above), even traveling along a very long path and bouncing back from the outer core before reaching the observation point, still manages to precede the PP phase that bounces once on the surface of the Earth (different variants are shown in light green, blue and purple in the ray path figure). The explanation of the reason why this occurs is in the figure below showing the model IASP91. The P-wave velocity increases significantly in the lower mantle below the depth of 670 km (the discontinuity that marks the boundary between the upper and lower mantle). The PcP wave travels a large part of its path crossing this high-speed region (11 to 13 km/s) and overtake the PP phase which travels entirely in the upper mantle (where the speed varies from 8 to 10 km/ s). The final gap is about 20 seconds: the PcP phase wins the race!
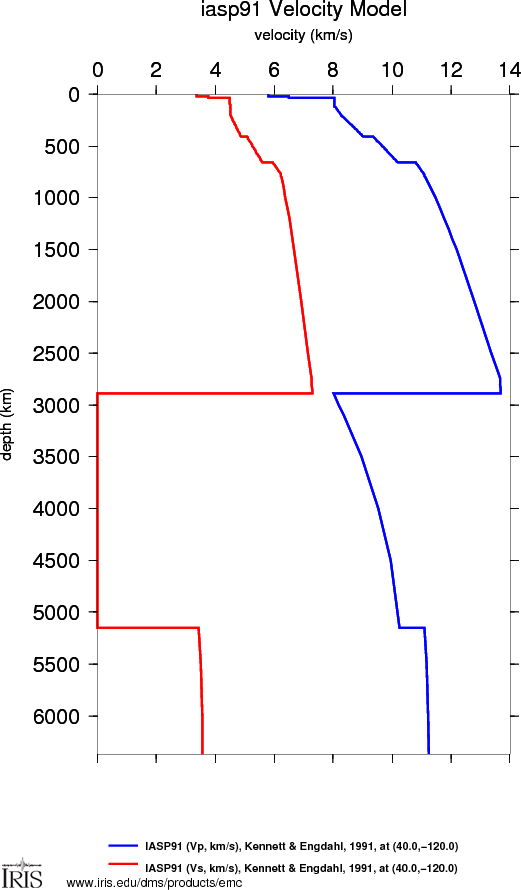
S-wave (in red) and P (in blue) velocities inside the Earth according to the model IASP91.